
Stewgreen has tracked down the NOAA climate disaster website, which the BBC used for their video yesterday.
https://www.ncdc.noaa.gov/billions/
It is evident just by looking at it that the whole thing is totally fraudulent. First a look at the map:
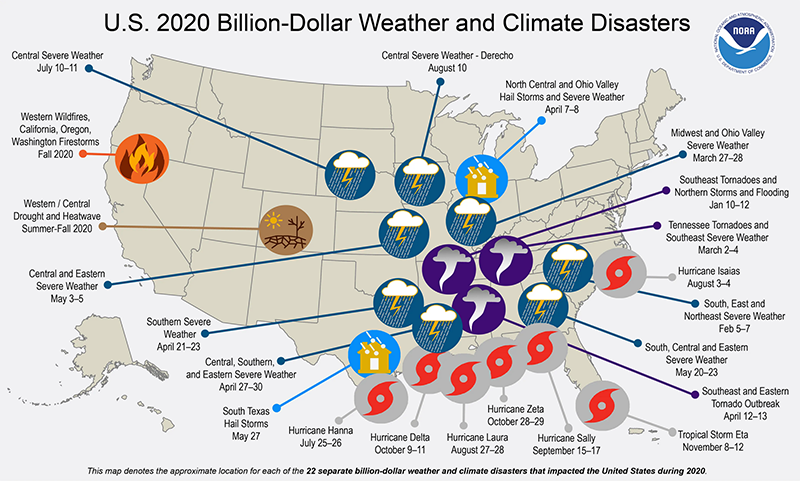
When a hurricane hits a populated stretch of coast, which is almost invariably, it is inevitable losses will be big.
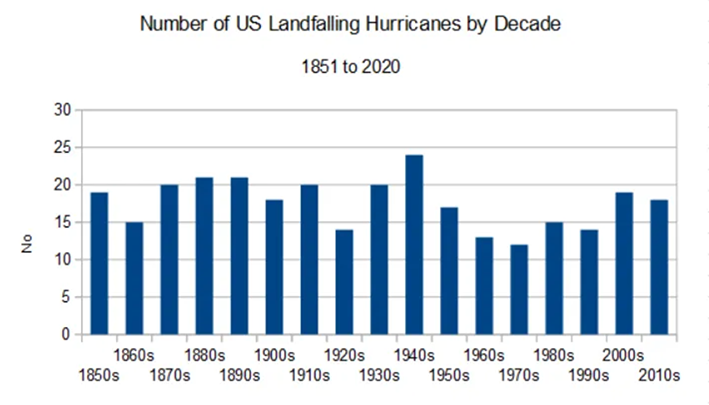
But while last year was a busy year for hurricanes, we do know that the frequency of US hurricanes has not been unusual in the last decade, and if anything the long-term trend is down. (Though it is worth noting that the 1980s and ’90s were below average, making the choice of 1980 as a start date statistically inappropriate):
 https://www.aoml.noaa.gov/hrd/hurdat/All_U.S._Hurricanes.html
However, the vast majority of these wrongly named “climate” disasters are either tornadoes, hailstorms, or severe weather (which are almost all thunderstorm/tornado outbreaks).
Again, we know that tornado activity has declined significantly since the 1970s. But we are expected to believe that tornadoes and thunderstorms nowadays are far more catastrophic than in the past.
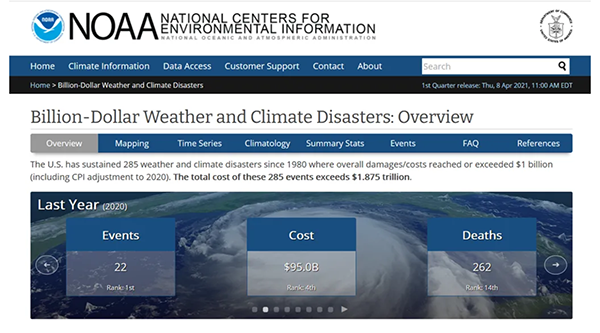
The answer to this riddle lies in how NOAA determines what a billion-dollar disaster is. The key is this sentence:
The U.S. has sustained 285 weather and climate disasters since 1980 where overall damages/costs reached or exceeded $1 billion (including CPI adjustment to 2020).
So, they rightly allow for inflation, but is that enough?
The simple truth is that Americans have much more “stuff” than they did back in 1980. Bigger houses, more cars, latest technological gadgetry, expensive furniture and clothes, and all the rest of it.
If a house burns down, the cost of rebuilding it and replacing contents will have increased by much more than inflation since 1980.
The same goes for local infrastructure and services.
The best way to monitor this is by looking at GDP, not CPI, which says that $1 in 1980 is now worth $3.32:
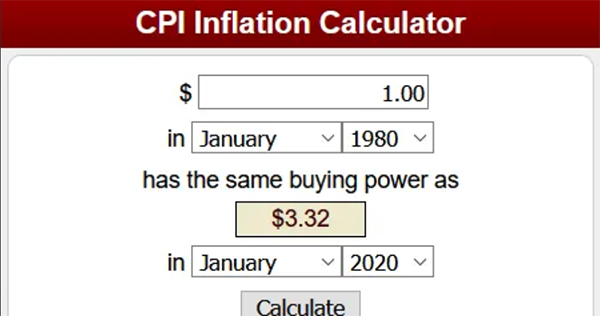
GDP however has risen from $2857bn in 1980 to $21433bn in 2019, which is 7.3 times as big.
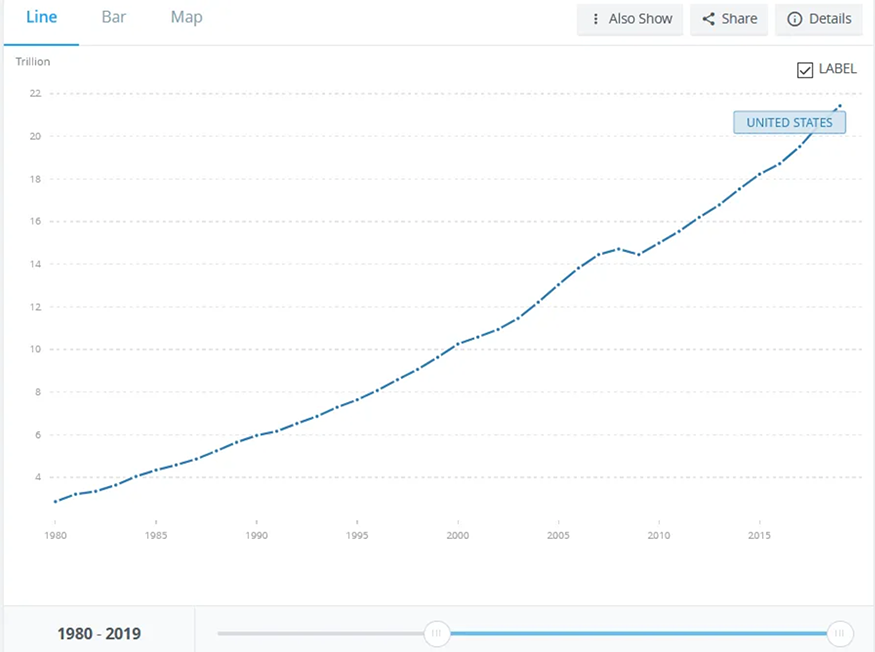 https://countryeconomy.com/gdp/usa
We can see the impact of rising wealth better by looking at constant GDP, which has been adjusted for CPI:
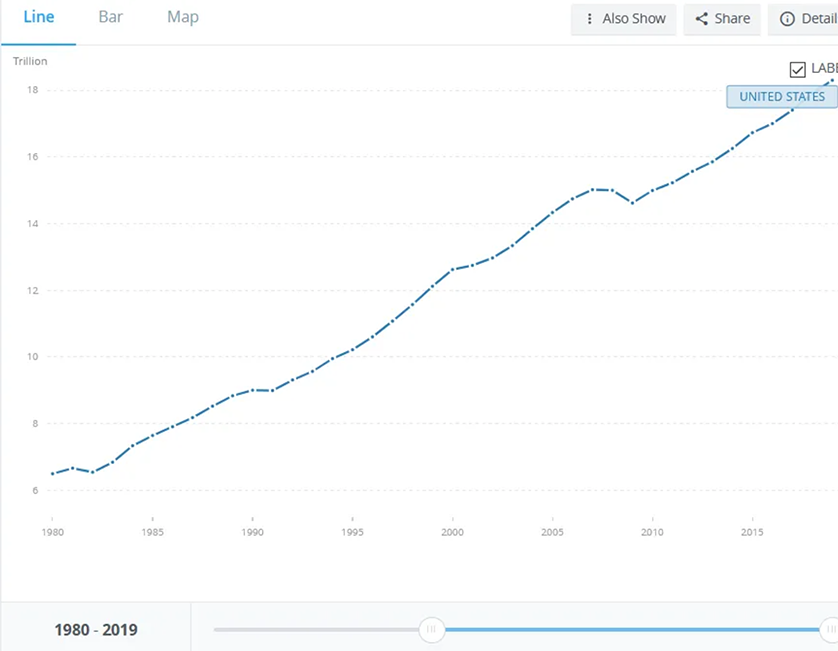
This index of GDP, which measures real growth, has jumped from $6.5 trillion in 1980 to $18.3 trillion, nearly trebling.
So when a billion-dollar disaster in 1980 is equivalent to a $3 billion one now…
Continue this report at Not A Lot Of People Know That
READ MORE CLIMATE CHANGE NEWS AT: 21st Century Wire Climate Files
PLEASE HELP SUPPORT OUR WINTER FUNDRAISING DRIVE HERE